Issue 016, 13 Jun 2021

Section A – Illumin8
Piotroski F Score

When the proverbial blood runs on the street and you end up coming out unscathed you are entitled to be happy. When this happens twice then you must be doing something well than others. What am I talking about?
It is the Piotroski F Score. Many of you following the markets would have heard about this too but I am not too sure how many of you thought about this as a successful strategy in itself?
What is Piotroski F Score?
Piotroski F Score is value obtained between 0 to 9 calculated as part of an accounting-based process of stock selection to identify the financial health of non-finance companies.
This was proposed by Joseph Piotroski in his 2002 research paper titled “Value investing- The use of historical financial information to separate winners from losers “
The paper aims to examine whether a simple accounting based fundamental analysis strategy when applied to broad portfolio of high book to market firms (low P/B- price / book value) can positively impact the returns earned by the investor?
The results were nothing short of fascinating:
Investors can use relevant historical information to eliminate firms with poor future prospects from a generic high BM portfolio. I show that the mean return earned by a high book-to-market investor can be increased by at least 7.5% annually through the selection of financially strong high BM firms and the entire distribution of realized returns is shifted to the right. In addition, an investment strategy that buys expected winner and shorts expected losers generates a 23% annual return between 1976 and 1996, and the strategy appears to be robust across time and to controls for alternative investment strategies.
Incidentally, Piotroski also found that the results were better in small and medium companies which had very little analyst following combined with low share turnover.
The research paper became quiet famous quickly and it became adopted also widely. During the 2008 financial crisis, the strategy got more recognition when the AAII found that this strategy delivered +30% where all the other more illustrious ones failed.
Calculating the F Score
The calculation involved checking 9 variables from a company’s financial statement. This was a binary approach of either assigning a score of 1 for every criterion the company passed and a value of 0 otherwise. The sum of the individual scores would be the Piotroski F Score .
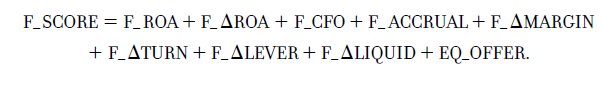
You can read the original research paper where each of these are explained in detail.
However for simplicity, we are highlighting the crux of each criteria
A. Profitability
1. Net Income – Score 1 if there is positive net income in the current year.
2. Operating Cash Flow – Score 1 if there is positive cashflow from operations in the current year.
3. Return on Assets – Score 1 if the ROA is higher in the current period compared to the previous year.
4. Quality of Earnings – Score 1 if the cash flow from operations exceeds net income before extraordinary items.
B. Leverage, Liquidity and Source of Funds
5. Decrease in leverage – Score 1 if there is a lower ratio of long term debt to in the current period compared value in the previous year .
6. Increase in liquidity – Score 1 if there is a higher current ratio this year compared to the previous year.
7. Absence of Dilution – Score 1 if the Firm did not issue new shares/equity in the preceding year.
C. Operating Efficiency
8. Score 1 if there is a higher gross margin compared to the previous year.
9. Asset Turnover – Score 1 if there is a higher asset turnover ratio year on year (as a measure of productivity).
How to read the score?
A score of 8 or 9 would indicate a strong financial position
0 to 2 would be poor
3 to 7 are the average ones.
Back-testing for Indian markets
If you are a regular reader of this newsletter, you would have realized that I would not be using any strategy as-is for the Indian markets. Every market has a mind of its own even though the broad contours are the same.
Over the last two decades I have experience “n” number of situations where what is written in famous investing journals and books based on the investing experiences of the US market are slightly different from how the Indian markets operate.
There are a lot of nuances which are very specific to the Indian markets which are not backed by any academic study or research but learnt from personal investing experiences. Hopefully you will pick up those from observing my stock pickings or reading my news letters.
Modified Piotroski Screen
I ran a Piotroski screen on NIFTY 500 for companies with a score greater than 7 plus a set of proprietary rules on profit margin , market capitalization & few others and back tested for 12 years with a monthly rebalancing .
Check the results for yourself
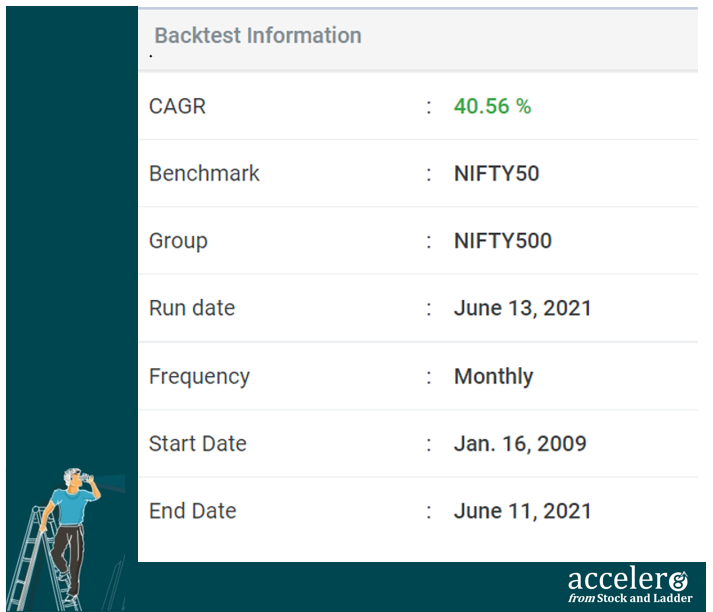
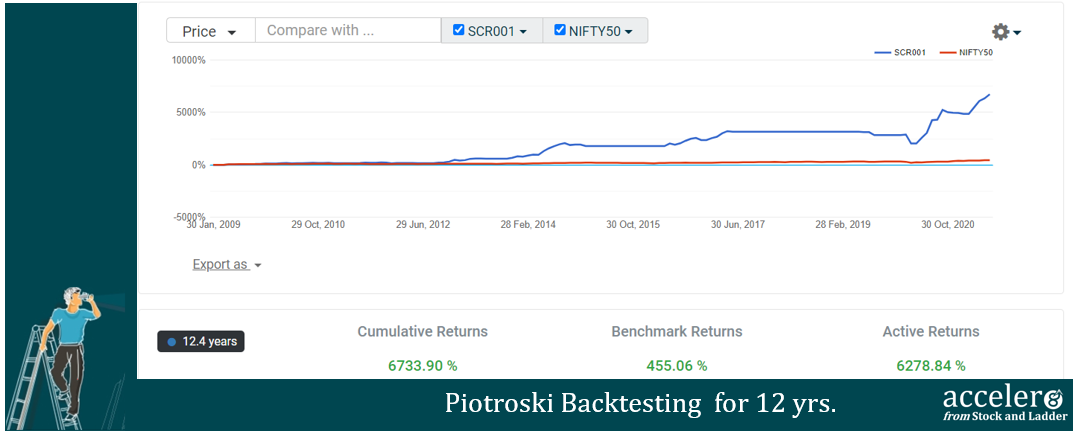
I mean 40% CAGR is unbelievable territory.
Next what? I am sure among many other things, probably there will be these two questions on top of your mind
a) Is there any stock which passes the screen right now?
b) Can I get regular updates on which stocks pass this screen ?
Answer to both the questions is YES.
The criterion already had 9 stringent conditions plus my proprietary set of rules meant that only very few number of stocks actually passed this tough screener.
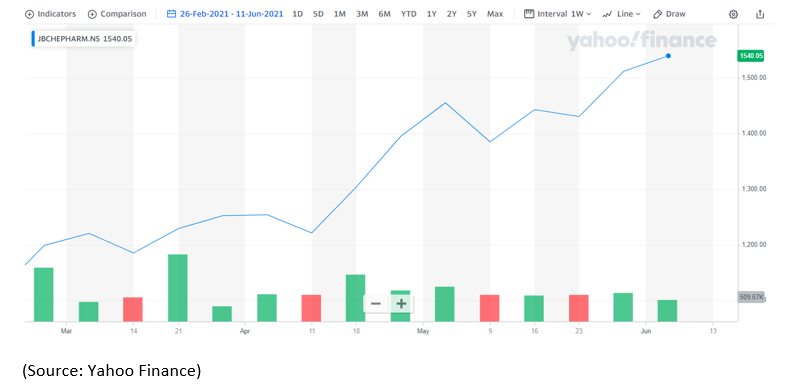
As of 11th June, only one stock is active: J B Chemicals and Pharmaceuticals. (Incidentally, the stock has passed the screen on 26th February 2021 based on back tested data.)
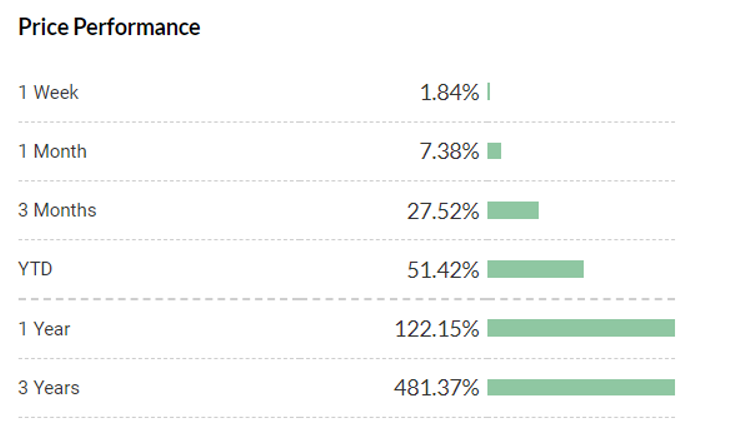
Price between 26 Feb to 11 Jun 2021
Coming to the second question as to regular updates on screens which are back tested and shared in earlier newsletters, I am happy to give you a heads-up that we will be having regular updates on each of these screens in a dedicated website. You will hear from us shortly on this.
Final thoughts
Piotroski F score is a powerful tool for checking the financial health of a company. As with any strategy there are certain short-comings like it keeps the finance sector stocks out of it and certain sectors which are less capital intensive tend to get better scores.
Check out this article for a critical view of this strategy. I personally feel this F Score is a fine place to start your research and can be one of the fine filters you can use to screen your investing universe.
Section B – acceler8
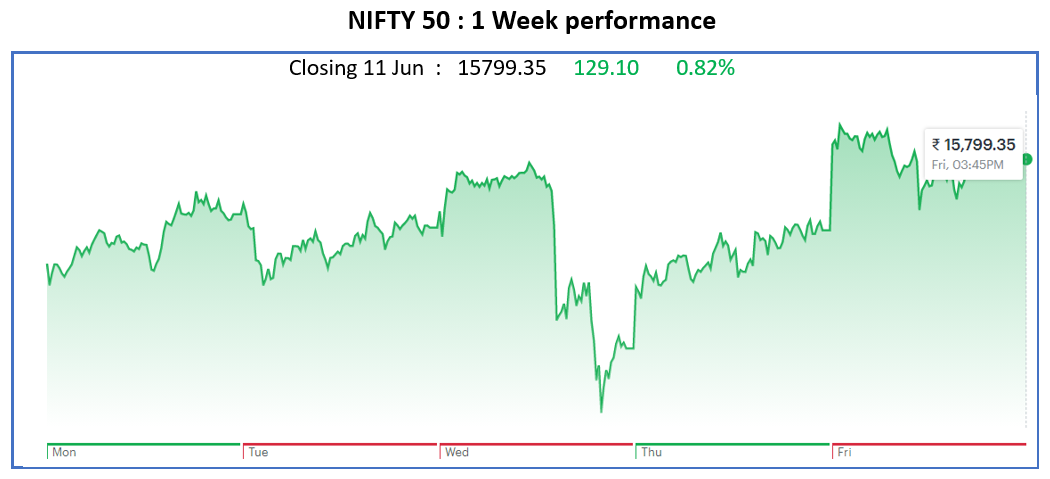
NIFTY50 Last Week
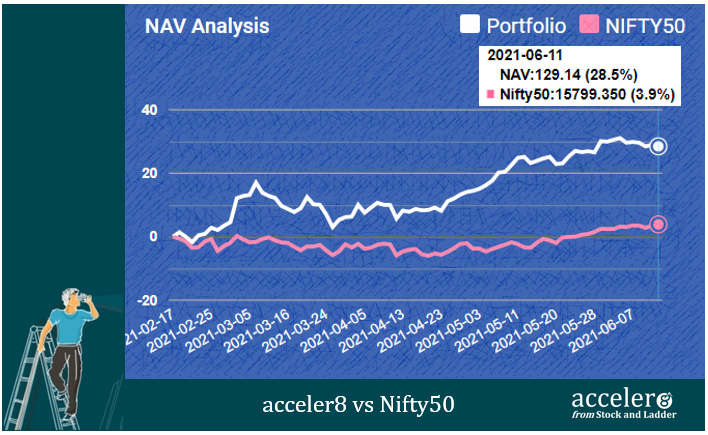
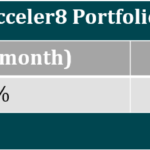
acceler8 portfolio NAV
As on 11 Jun 2021, the NAV of acceler8 portfolio is 129.14 (+28.5%) and has outperformed the benchmark Nifty50 by a significant margin (+24.6%).
Trades done for the week
The following trades were done this week.
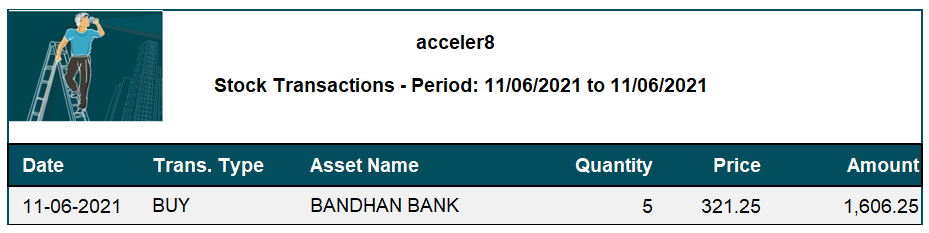
Bandhan Bank was the largest player in the Microfinance segment. Post conversion to Bank, the institution has been clocking excellent numbers until very recently.
Bluechip credentials
Largest Microfinance player
Excellent financials
HDFC Parentage
Beneficiary of Govt’s thrust for inclusive banking
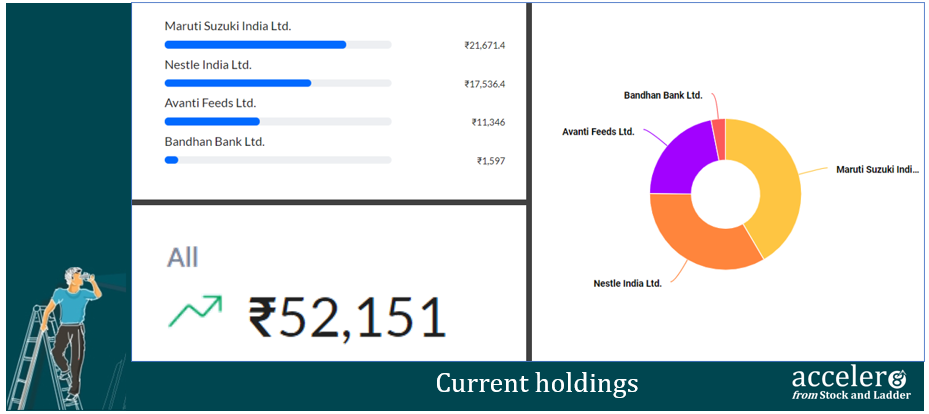
Current Position
As on 11 Jun, the consolidated value of current holdings is at ₹52,151 with around 51% in cash. With markets at peak, we will be cautiously optimistic with our trades.
Section C – Stock Screeners
Momentum 20 – 20 Screener
Momentum 20-20 portfolio had 3 stocks :
1. Grindwell Norton
2. Tata Elxsi
3. Colgate Palmolive India
Rebalancing for this Week
2 Entries and 1 Exit
Entries
Exit
Colgate Palmolive India
Revised Portfolio
1. Grindwell Norton
2. Tata Elxsi
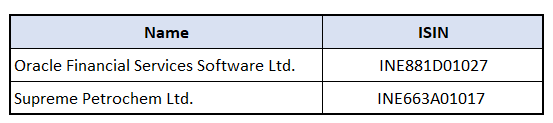
3. Oracle Financial Service Software Ltd.
4. Supreme Petrochem Ltd.
Responses to questions in the Comments section
Q: Why do choose a small set for India in comparison to the reference USA market .
In India, beyond NIFTY 50 and SENSEX 30, the availability of good funds covering NIFTY 500 or NIFTY 200 is not vast. Hence for the Indian markets, those who want to practice Index Investing, need to choose one of these better followed indices.
Q: Secondly , in the last 24 months there has been poor earnings growth on overall basis and there is polarization in the active stocks ( based on high ROCE , management reputation , or the future business prospects ) . So in this basis shouldn’t we have a broader index weighted strategy or even the NSE 500 itself ?
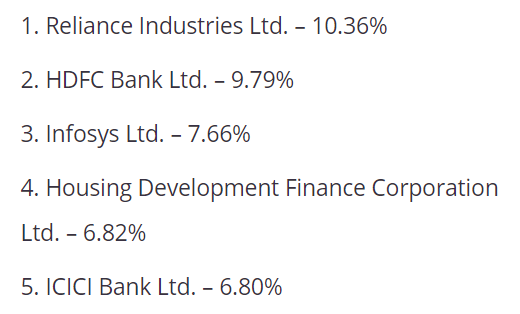
Personally, I am of the opinion that the Indices in the Indian market are heavily skewed and top 4 or 5 stocks have a disproportionate allocation (more than 40%) with rest of the 45 stocks amounting the remaining 60%.
Please also note that the breadth and depth of offering based on NIFTY 500 is relatively poor and also has a lower track record of performance.
PS : Thank you to all subscribers who have joined the accumul8 journey, you will hear from us shortly.
Until next week, stay safe and take care.
Happy Investing!


Do you love Reading?
Check out the best books to read at the Superinvestors Bookshelf Let’s stay connected, Follow me on Twitter @Stocknladdr